B2B, AI Chat, Dashboard
Designing an AI co-pilot that music executives actually trust
Artist managers were drowning in data and starving for insight. I designed Alfred, an AI co-pilot that tells you what to do next, not just what happened.
Overview
Overview & Why This Case Study
A music manager's job is to decide: when to release, where to tour, who to collaborate with. These are high-stakes calls made on gut feel because the data is scattered across 35+ platforms with no connective tissue. Alfred was built to be that connective tissue. An AI that synthesizes everything and speaks in plain English.
Problem
Data rich, insight poor and honestly, a bit overwhelmed.
Before we touched a single Figma frame, we spent the first three weeks just watching and listening. What we found was pretty humbling: every artist manager we talked to had their own cobbled-together system; a Spotify for Artists tab, a Chartmetric window, a Bandsintown bookmark, and a spreadsheet that only they understood. The average manager was context-switching across six different tools before making a single strategic call.

Research and Discovery
We stopped asking questions and started observing.
The single best decision we made in the research phase was abandoning the interview script. Structured interviews with music managers give you what people think they do. Watching them actually work gives you what they actually do. Those are often completely different things.


Ideation & Prototyping
Post-it notes to Claude Code to high-fidelity in 3 weeks.
We ran three rapid ideation sprints, each one building on the last. The biggest single accelerator? Using Claude Code to build a working Alfred prototype with a real LLM backend in 4 hours -before any design was polished. Testing with real AI variability rather than scripted copy changed our research findings significantly.

Team & Cross-Functional Collaboration
Leading a team, not just the design.
One of the things I'm proudest of in this project is how the two designers I managed grew through it. My job was to set clear ownership boundaries, protect their autonomy, and only step in when there was a strategic decision to be made, not to do the work for them.

Solution
What we actually shipped and why.
Retention Driver
Proactive Insight Sidebar
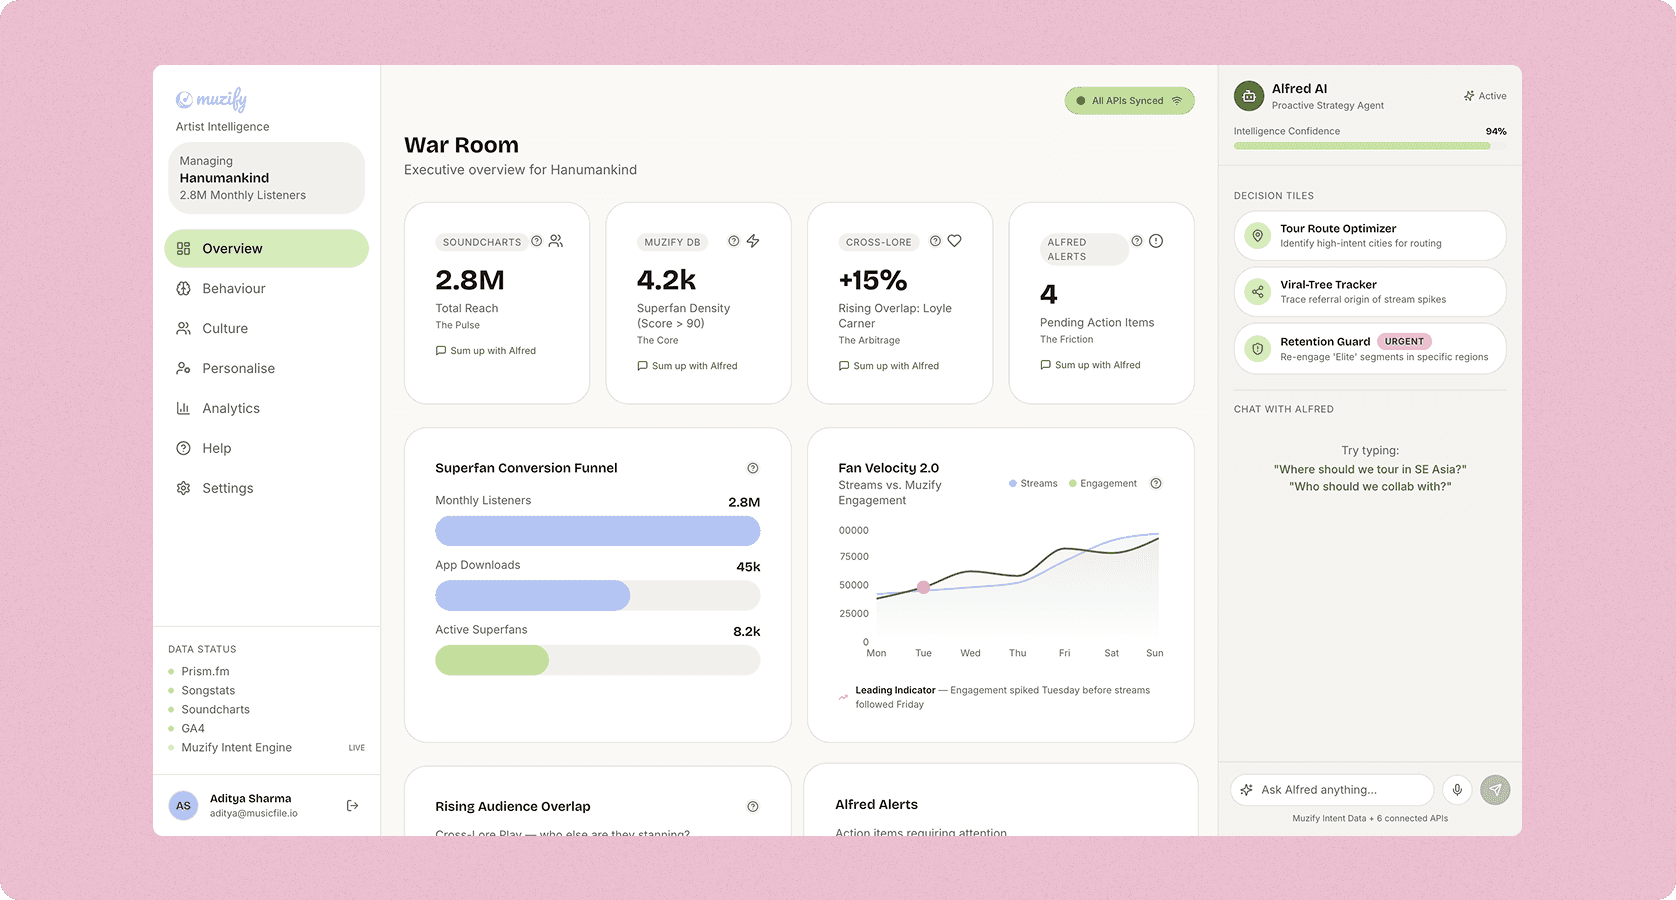
Alfred lives as a persistent right-rail sidebar that listens to on-screen data instead of hiding in a chatbot. It identifies interesting events like Kochi spikes or dormant superfan segments to inform you before you ask. This proactive model was the primary driver behind the retention jump from 22% to 41%.
Adoption Driver
Structured Decision Tiles
To solve prompt anxiety for senior stakeholders, we transformed complex LLM interactions into one-click Decision Tiles like Tour Route Optimizer. We codified a design system constraint to show a maximum of one urgent tile at a time, ensuring that critical insights remain prioritized and actionable.
USP Differentiator
The Leading Indicator Chart
We layered Quiz Velocity over GA4 Web Traffic to visualize engagement as a leading indicator of future streaming spikes. When these data lines diverge, Alfred flags it as a positive migration signal. This visualization became the most-cited feature in NPS feedback for providing clear context behind streaming fluctuations.
CRM innovation
Segment Builder
The Personalise tab features a hybrid search bar that parses natural language for artists while maintaining precise filters for data-savvy managers. The real-time counter provides instant feedback on fan matches, encouraging managers to experiment with different filter combinations rather than committing to a single view.
Behaviour Change
Global Command
Usability testing showed that managers viewed low-engagement cities as problems to avoid rather than opportunities. We shifted this perception by renaming "Low" tiers to "Emerging" and adding descriptive badges. This linguistic and design change directly influenced booking behavior by highlighting high-intent growth areas.
Learnings
Post-launch & beta learnings
Launch day is when the real design work starts. We ran bi-weekly retrospectives with beta users, maintained a live feedback board that the whole team could see, and I personally watched a session replay for every piece of feedback that mentioned Alfred by name. Here's what the first 8 weeks post-launch taught us:

Next work
